Trading with Bollinger Bands
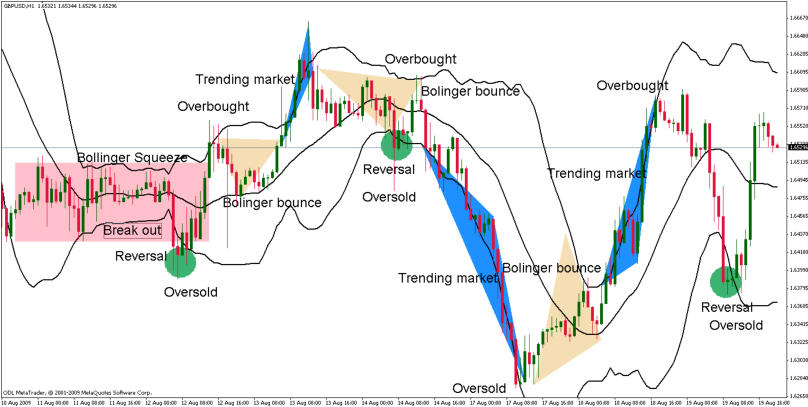
Bollinger Bands are one of the more popular indicators used in Forex day trading and is developed by John Bollinger. This indicator is considered a leading indicator as 80% of price is contained within the upper and lower bands. This band consists of three lines; upper, lower and center. The upper and lower lines are plotted as two standard deviations from the center line and measures price volatility. When the market is flat and consolidated the bands are contracted and form a narrow channel. When the market is starts trending the outer bands expands and often the candles will continuously pierce the outer band signifying that the trend is continuing. There are a number of popular trading strategies used by traders that cater for consolidated market conditions, trending markets, and reversals. Reversals During normal trading conditions the slope of the bands will indicate the market direction. When price hits one of the outer bands this could be an indication that the market is either overbought or oversold and a common practice is to enter a trade in the opposite direction when a new bar opens outside one of the outer bands and stay in the trade until price hits the opposite outer band or stops at the mid band. Trending Market When price continuously pierces an outer band then we trade in that direction until price once again opens inside the outer bands before closing our position. When the market is trending the bands will expand. Bollinger Bounce When the market is ranging, price generally tends to return to the center line or to the opposite outer band; this allows traders to trade off these lines; then reverse their positions once they bounce off the opposite band or the center line. Bollinger Squeeze When the market is flat with very little volatility the bands narrow forming a channel. This is normally the precursor to a breakout; the longer this condition exists the bigger the breakout is likely to be. During this period of consolidation price will generally oscillate between the upper and lower bands until the breakout occurs.
© Copyright 2015 - FX Hometrader - All rights reserved.


- Forex Trading Chart Patterns
- Price Actions Charts
- Fibonacci Trading
- Fibonacchi Levels Tutorials
- Trading with the Elliott Wave
- Trading with Bollinger Bands
- Trading with the MACD
- Candlestick Trading Tutorial
- Pivot Points Trading
- Trading with the RSI Indicator
- Trading with the Stochastic Indicator
- Swing Trading Strategy
- Support and Resistance Levels
- Stop Loss Tutorial


Trading with Bollinger
Bands
Bollinger Bands are one of the more popular indicators used in Forex day trading and is developed by John Bollinger. This indicator is considered a leading indicator as 80% of price is contained within the upper and lower bands. This band consists of three lines; upper, lower and center. The upper and lower lines are plotted as two standard deviations from the center line and measures price volatility. When the market is flat and consolidated the bands are contracted and form a narrow channel. When the market is starts trending the outer bands expands and often the candles will continuously pierce the outer band signifying that the trend is continuing. There are a number of popular trading strategies used by traders that cater for consolidated market conditions, trending markets, and reversals. Reversals During normal trading conditions the slope of the bands will indicate the market direction. When price hits one of the outer bands this could be an indication that the market is either overbought or oversold and a common practice is to enter a trade in the opposite direction when a new bar opens outside one of the outer bands and stay in the trade until price hits the opposite outer band or stops at the mid band. Trending Market When price continuously pierces an outer band then we trade in that direction until price once again opens inside the outer bands before closing our position. When the market is trending the bands will expand. Bollinger Bounce When the market is ranging, price generally tends to return to the center line or to the opposite outer band; this allows traders to trade off these lines; then reverse their positions once they bounce off the opposite band or the center line. Bollinger Squeeze When the market is flat with very little volatility the bands narrow forming a channel. This is normally the precursor to a breakout; the longer this condition exists the bigger the breakout is likely to be. During this period of consolidation price will generally oscillate between the upper and lower bands until the breakout occurs.
© Copyright 2017 - FX Hometrader - All rights reserved.


- Home
- Introduction to Forex Trading
- Trading Requirements
- Forex Trading Times
- How to Choose Your Broker
- Brokerage Firms
- About Managed Accounts
- Technical Analysis Tutorials
- Forex Trading Tutorials
- Price Action Charts
- Fibonacci Trading
- Fibonacci Levels Tutorial
- Trading with the Elliott Wave
- Trading with Bollinger Bands
- Trading with MACD
- Candlestick Trading Tutorial
- Pivot Points Trading Tutorial
- Pivot Point Calculator
- Trading with the RSI Indicator
- Trading with the Stochastic Indicator
- Swing Trading Strategy
- Stop-Loss Tutorial
- Free Trading Magazines
- Free Trading Software
- Forex Trading Books
- Forex Trading Articles
- Glossary
- About Us
- Contact Us